system.opentelemetry_span_log Introspection
The OpenTelemetry Span Log Introspection tool lets you analyze spans stored in ClickHouse’s system.opentelemetry_span_log table. Use it to inspect trace span distribution over time, filter by host or span kind, and explore individual span records with clickable trace IDs for deeper analysis.
Overview
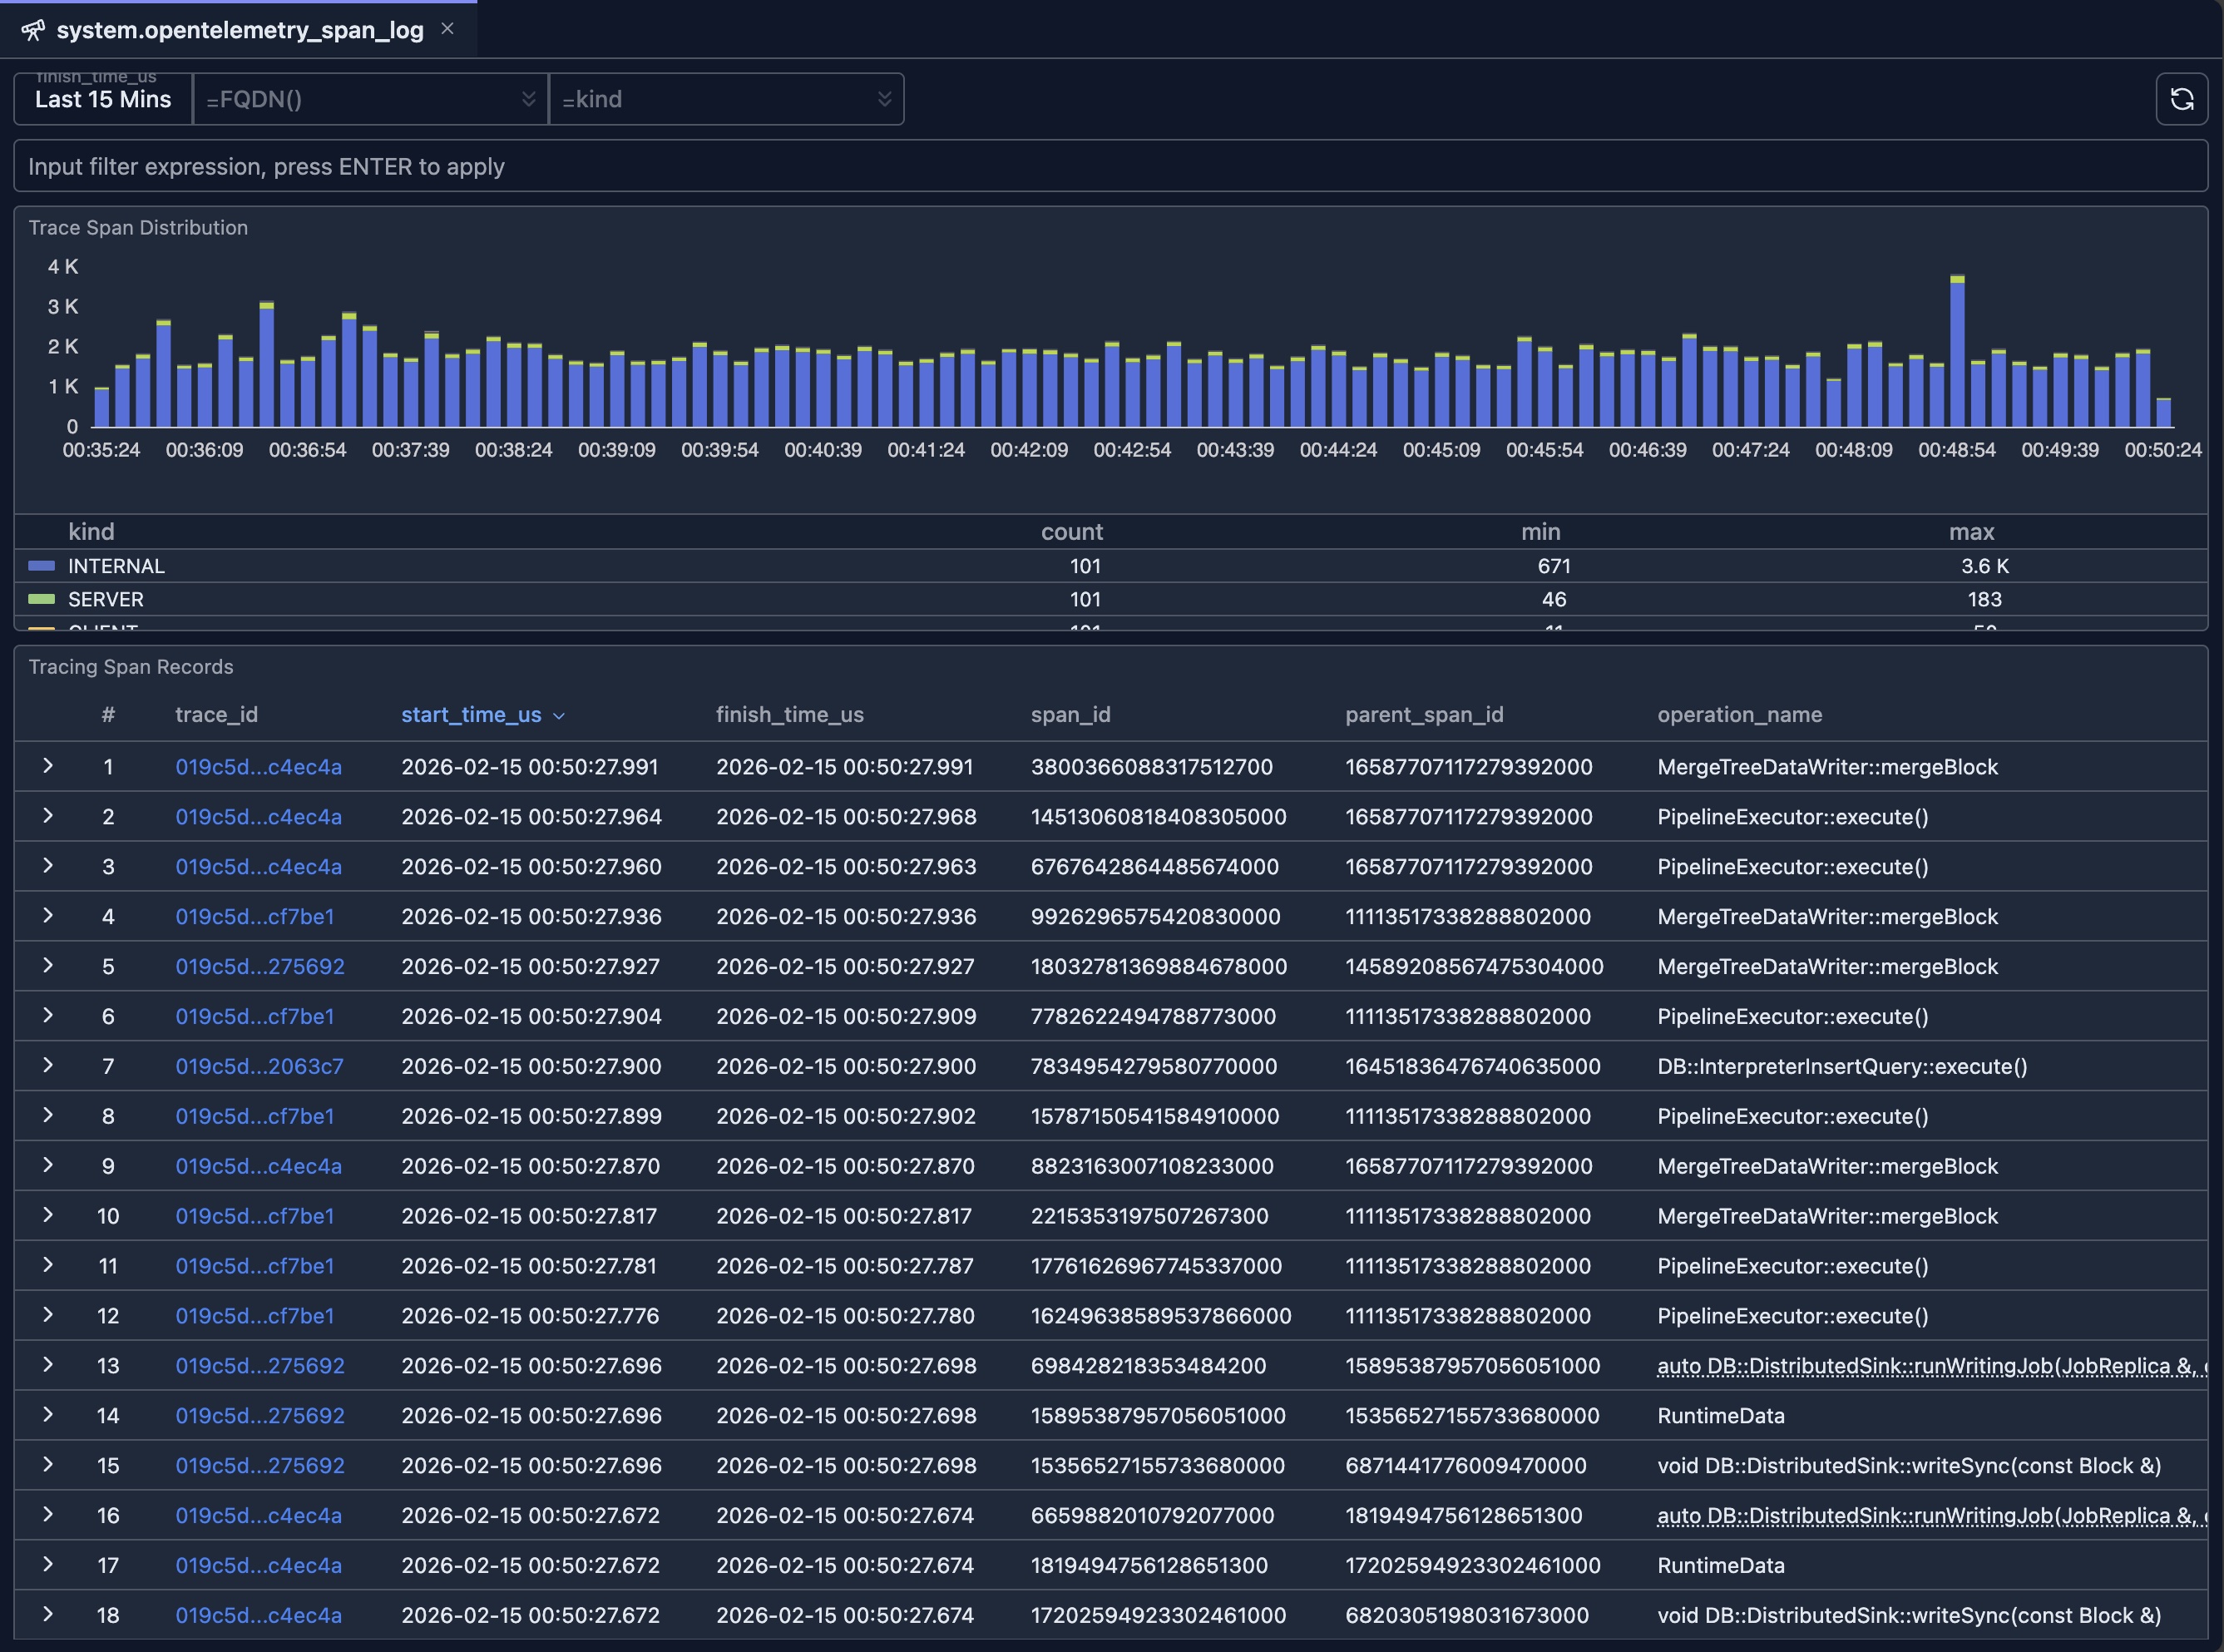
When ClickHouse is configured to produce OpenTelemetry trace data, span events are written to system.opentelemetry_span_log. This introspection UI provides:
- Time-scoped analysis — Choose a time range (default: last 15 minutes) for all charts and the table.
- Trace Span Distribution chart — Stacked bar chart of span counts over time, grouped by span
kind(e.g. server, client, internal). - Tracing Span Records table — Paginated, sortable list of span rows with trace ID links, start/finish times, span IDs, and optional row details.
You can combine time range, hostname (FQDN), and span kind filters to focus on specific nodes or span types.
Prerequisites
- ClickHouse is configured to write tracing data into
system.opentelemetry_span_logtable. - Read access to the
system.opentelemetry_span_logtable.
UI
If the trace_id column is clicked, a new tab will be open to allow you to inspect the details of the given trace span logs as demonstrated in the following video.
When to use this tool
Distributed tracing and debugging
- Find traces by time: Set a time range and scan the table for slow or failed operations.
- Filter by host: Use FQDN to see spans only from the node you care about.
- Filter by kind: Use span kind to focus on server spans, client calls, or messaging spans.
- Follow a trace: Click a trace ID to open the full trace in the inspector.
Observability and capacity
- Volume over time: Use the distribution chart to see span throughput and which kinds dominate.
- Compare nodes: Change FQDN filter to compare span volume or kinds across replicas.
- Narrow by expression: Use the input filter for custom conditions (e.g. by service or attribute).
Integration with other tools
- Span Log Inspector: Use trace ID links from this table to jump into timeline and topology views for a single trace.
- Other system tables: Cross-reference with system.query_log or system.query_views_log when correlating queries with traces.
Related documentation
- System Log Introspection — Overview of all system log introspection tools
- Query Log Inspector — Timeline and topology for a single query or trace
- Schema Explorer — Explore databases and tables, including
system.opentelemetry_span_log - Node Dashboard — Node-level metrics and health