Schema Explorer
The Schema Explorer provides an intuitive, tree-based interface for navigating your ClickHouse databases, tables, columns, and metadata. It serves as the central navigation hub in DataStoria, allowing you to quickly access and explore your database structure.
Overview
The Schema Explorer displays your ClickHouse schema as an expandable tree structure, showing:
- Databases: All databases in your ClickHouse instance
- Tables: All tables within each database
- Columns: Table columns with data types and metadata
- Comments: Database, table, and column comments (if available)
- Table Engines: Engine type for each table
- Cluster Nodes: In cluster mode, shows nodes and their schemas
Accessing the Schema Explorer
The Schema Explorer is located in the left sidebar of the DataStoria interface. It automatically loads when you connect to a ClickHouse instance.
Initial Load
- Automatic Loading: Schema loads automatically upon connection
- Progress Indicator: Shows loading progress during initial schema fetch
- Error Handling: Displays error messages if schema loading fails
Tree Structure
Hierarchy
The schema tree follows this hierarchy:
Host/Cluster
  └── Database
      └── Table
          └── Column -- Data Type
Node Types
Host/Cluster Node
- Single Node: Shows the hostname where the schema tree information is returned
- Cluster Mode: Shows the hostname where the schema tree information is returned with a selection list showing all nodes in the cluster
- Actions: Refresh schema, switch nodes (in cluster mode)
Navigation Features
Search Functionality
The Schema Explorer includes a powerful search feature, search from databases/tables/columns.
Search Behavior
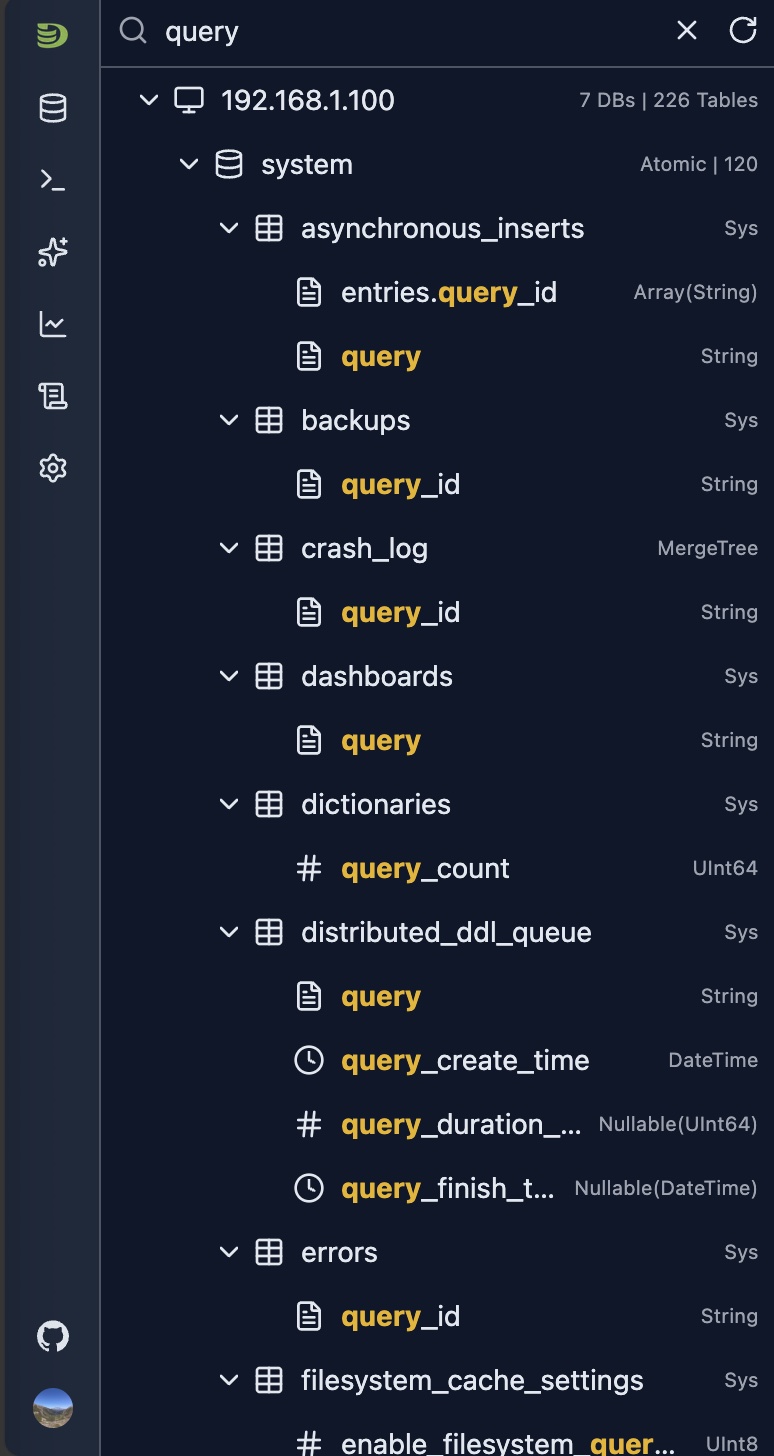
Real-time Filtering: Search is performed at local, results update as you type
Fuzzy Matching: Finds partial matches in names with exact match(See dot mode below)
- Under Fuzzy matching, you can search a database/table/column. The matched items will be displayed hierachy under their databases/tables
Case Insensitive: Search is not case-sensitive
Scope: Searches across databases, tables, and columns
Dot mode
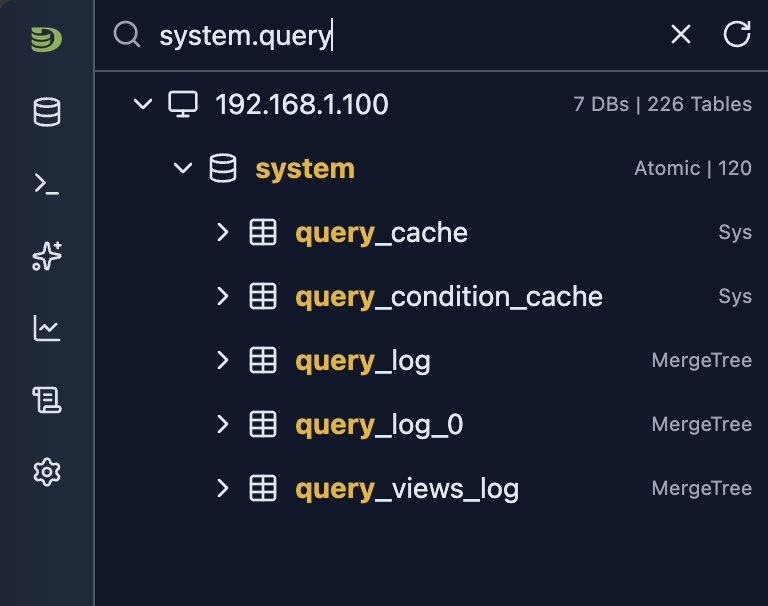
By default the search is performed across all database, tables, columns.But if a dot character is input, the text before the first dot character will be treated as a exact match against database. And the text between first dot and second dot character will be treated as an extract table name.
Once the dot is typed, and there is a database match, the matched database will automatically expand its tables. So does the table exact match.
Examples
- Search database/table/columns that contains 'query'
- Search table
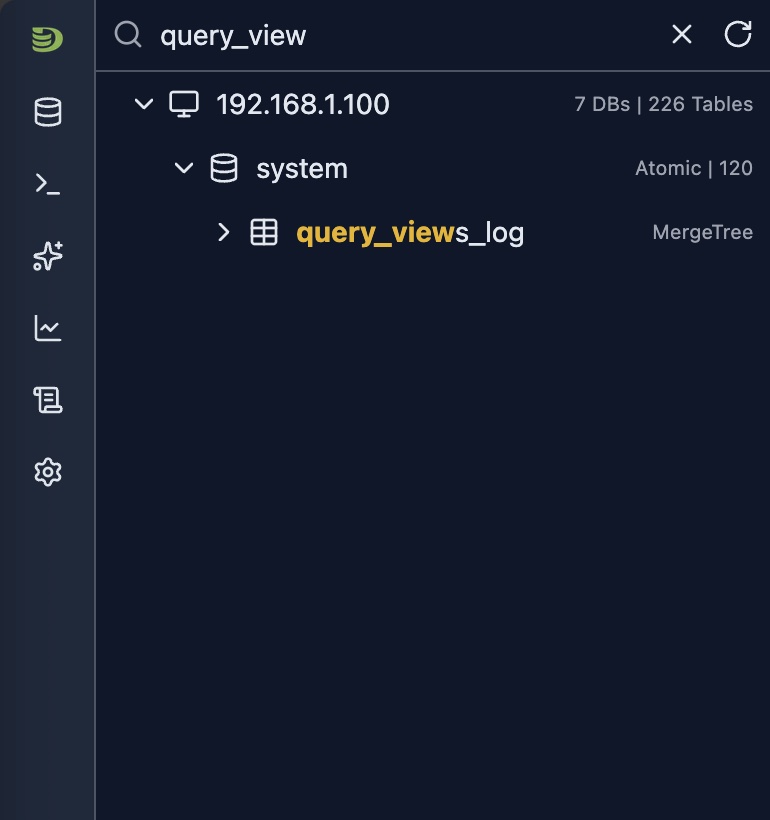
- Search tables under a given database(DOT Mode)
Context Menus
Right-click on any node to access context menu options.
Actions and Shortcuts
Open Node Dashboard Tab
- Method: Click host name
- Shows: The node dashboard in a tab
Open Database Tab
- Method: Click database name
- Shows: Database overview with tables, statistics and table dependencies
Open Table Tab
- Method: Click table name
- Shows: Table details including:
- Table metadata
- Column information
- Data sample
- Partitions
- Query history
- Dependencies
Limitations
- Real-time Updates: Schema changes require manual refresh
- Performance: Initial load time depends on schema size
- Permissions: Schema visibility depends on user permissions
Integration with Other Features
- Query Editor: Drag table names from schema tree to query editor (if supported)
- Table Tabs: Open multiple tables in separate tabs
Next Steps
- SQL Editor — Query the tables you've discovered
- Natural Language Queries — Ask questions about your data
- Cluster Dashboard — Monitor cluster-wide metrics
- Node Dashboard — Monitor individual node performance